Cutting forecast error in half with a unified data pipeline
How a fragmented, spreadsheet-bound forecasting process became one trusted pipeline — and halved forecast error along the way.
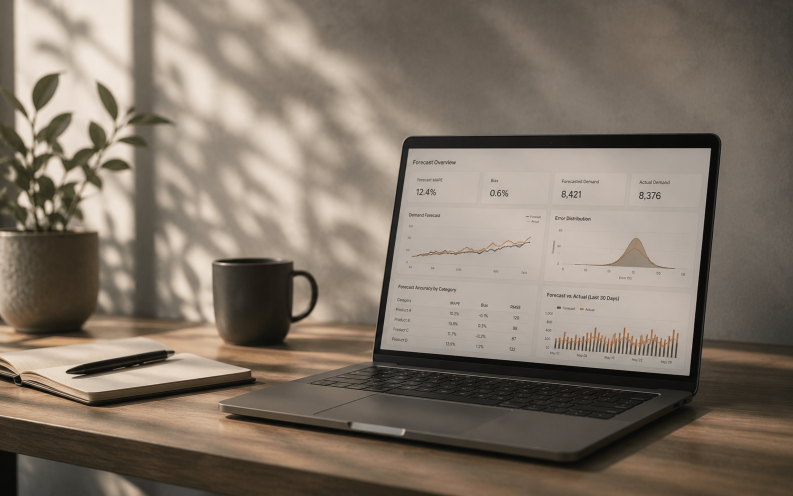
A mid-market distribution business was running one of its most important numbers — the demand forecast — across a dozen disconnected spreadsheets. Each region kept its own version, reconciled by hand, and by the time the figures reached leadership, nobody entirely trusted them.
The symptoms were familiar: stock in the wrong places, decisions delayed by "let me check that number," and a planning team spending more time assembling data than thinking about it.
The challenge
- Forecast inputs lived in siloed spreadsheets with no single source of truth.
- Manual reconciliation took days and introduced errors of its own.
- Because the numbers were distrusted, they were quietly overridden by gut feel.
- No one could trace how a given forecast figure had been produced.
What we did
We didn't start with a model. We started with the plumbing.
Unified the data
We consolidated the regional sources into a single governed pipeline — automated ingestion, validation, and a documented flow from raw input to final figure.
Made the numbers trustworthy
Reconciliation checks, freshness monitoring and tests now run automatically, so a broken input is caught before it reaches a decision rather than after.
Rebuilt the forecast on solid ground
Only once the data was reliable did we improve the model itself, with a clear evaluation harness so every change could be measured instead of argued.
The results
- Forecast error cut by roughly half — driven far more by clean, unified data than by a cleverer model.
- Reconciliation dropped from days to minutes, freeing the planning team to analyse instead of assemble.
- One trusted number that leadership stopped second-guessing — the real unlock.
The model got the credit. The data pipeline did the work.
The lesson generalises: most forecasting problems are data problems wearing a modelling costume. Fix the plumbing and the accuracy tends to follow.
Have a forecast nobody trusts? That's usually where we start.